Poster #221, Ground Motions
Region-specific Fourier-based site amplification modeling


Poster Image:

Poster Presentation
2020 SCEC Annual Meeting, Poster #221, SCEC Contribution #10394 VIEW PDF
on the SCEC BBP for site amplification.
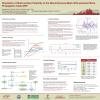
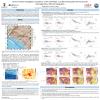
This model incorporates several updates from our previous work: including refining the analysis regions and expanding the database of recorded ground motions with those recorded since the conclusion of the NGA West2 project; these extra data have been compiled by Wang and Stewart (2019), Nweke et al. (2018) and Buckreis et al. (2019). The linear portion of the model has southern- and northern- California region-specific terms. The nonlinear portion of the model is developed from a combined database, including data from outside of California. We work with Fourier amplitude spectra (FAS) residuals from the Bayless and Abrahamson (2019; BA19 hereafter) ergodic FAS GMPE.
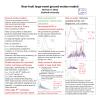
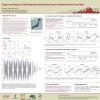
Overall, the linear Vs30 scaling models compare favorably with other empirically-based models (e.g. Bora et al. 2019; Seyhan and Stewart, 2014); especially at low frequencies. The Hashash et al. (2019) model is most different because it features peaks in amplification over distinct frequency bands which correspond to resonance with the modal frequencies of the Vs profile. The data analysis implies considerable regional variations in the linear Vs30 scaling. Based on our results, the Los Angeles region has stronger linear Vs30 scaling of FAS than the Bay Area region at low frequencies.
SHOW MORE
This model incorporates several updates from our previous work: including refining the analysis regions and expanding the database of recorded ground motions with those recorded since the conclusion of the NGA West2 project; these extra data have been compiled by Wang and Stewart (2019), Nweke et al. (2018) and Buckreis et al. (2019). The linear portion of the model has southern- and northern- California region-specific terms. The nonlinear portion of the model is developed from a combined database, including data from outside of California. We work with Fourier amplitude spectra (FAS) residuals from the Bayless and Abrahamson (2019; BA19 hereafter) ergodic FAS GMPE.
Overall, the linear Vs30 scaling models compare favorably with other empirically-based models (e.g. Bora et al. 2019; Seyhan and Stewart, 2014); especially at low frequencies. The Hashash et al. (2019) model is most different because it features peaks in amplification over distinct frequency bands which correspond to resonance with the modal frequencies of the Vs profile. The data analysis implies considerable regional variations in the linear Vs30 scaling. Based on our results, the Los Angeles region has stronger linear Vs30 scaling of FAS than the Bay Area region at low frequencies.
SHOW MORE
Citation: Bayless, J., & Stewart, J. P. (2020, 08). Region-specific Fourier-based site amplification modeling. Poster Presentation at 2020 SCEC Annual Meeting.
Keywords: Site Amplification, Ground Motion Model
SCEC Award: 19097
MORE FROM GROUND MOTIONS

|

|
|

|

|

|
|

|

|

|

|

|

|
|

|

|

|

|

|
|

|

|

|