SCEC UGMS Committee Meeting
Conveners: C.B. Crouse and Tom Jordan
Dates: November 3, 2014 (10:00 - 15:30)
Location: SCEC Boardroom, USC, Los Angeles
SUMMARY: The SCEC Committee for Utilization of Ground Motion Simulations (or "UGMS Committee") is tasked to develop long-period response spectral acceleration maps for Los Angeles region for inclusion in NEHRP and ASCE 7 Seismic Provisions and in Los Angeles City Building Code. The maps would be based on 3-D numerical ground-motion simulations, and ground motions computed using latest empirical ground-motion prediction equations from the PEER NGA project. This project is coordinated with (1) the SCEC Ground Motion Simulation Validation Technical Activity Group (GMSV-TAG), (2) other SCEC projects, such as CyberShake and UCERF, and (3) the USGS national seismic hazard mapping project.
Presentation slides may be downloaded by clicking the links following the title. PLEASE NOTE: Files are the author’s property. They may contain unpublished or preliminary information and should only be used while viewing the talk.
Monday, November 3, 2014
| 10:00 - 10:10 | Welcome, Attendee Introductions, and Agenda Review | |
| 10:10 - 10:20 | Introductory Remarks & Meeting Agenda | C.B. Crouse / Tom Jordan |
| 10:20 - 10:30 | Review of UGMS Mission & Progress | C.B. Crouse |
| 10:30 - 11:00 | Short Review of CyberShake (PDF, 9MB) | Tom Jordan |
| 11:00 - 11:15 | Description of Calculations of Risk-Targeted Maximum Considered Earthquake Response Spectra (MCER) at 14 Southern California Sites (PDF, 1.6MB) | C.B. Crouse |
| 11:15 - 12:00 | Introduction to CyberShake and NGA MCER Results (PDF, 1.6MB) (HANDOUT: Selected study sites with velocity information (PDF, 429KB) |
Scott Callaghan |
| 12:00 - 13:00 | Lunch | |
| 13:00 - 14:00 | Discussion of CyberShake and NGA MCER Results | |
| 14:00 - 15:00 | Future Work to Enhance CyberShake - Extend to T = 1 sec - Investigate effect of near surface geology - Earthquake source modeling - Coordination with TAGs and NGA West2 enhancements |
C.B. Crouse |
| 15:00 - 15:15 | Schedule for Producing Long Period MCER Maps for L.A. Region | |
| 15:15 - 15:30 | Results to be presented and tentative dates for next UGMS Meeting | Tom Jordan |
| 15:30 | Adjourn |
PARTICIPANTS
*Remote Participants
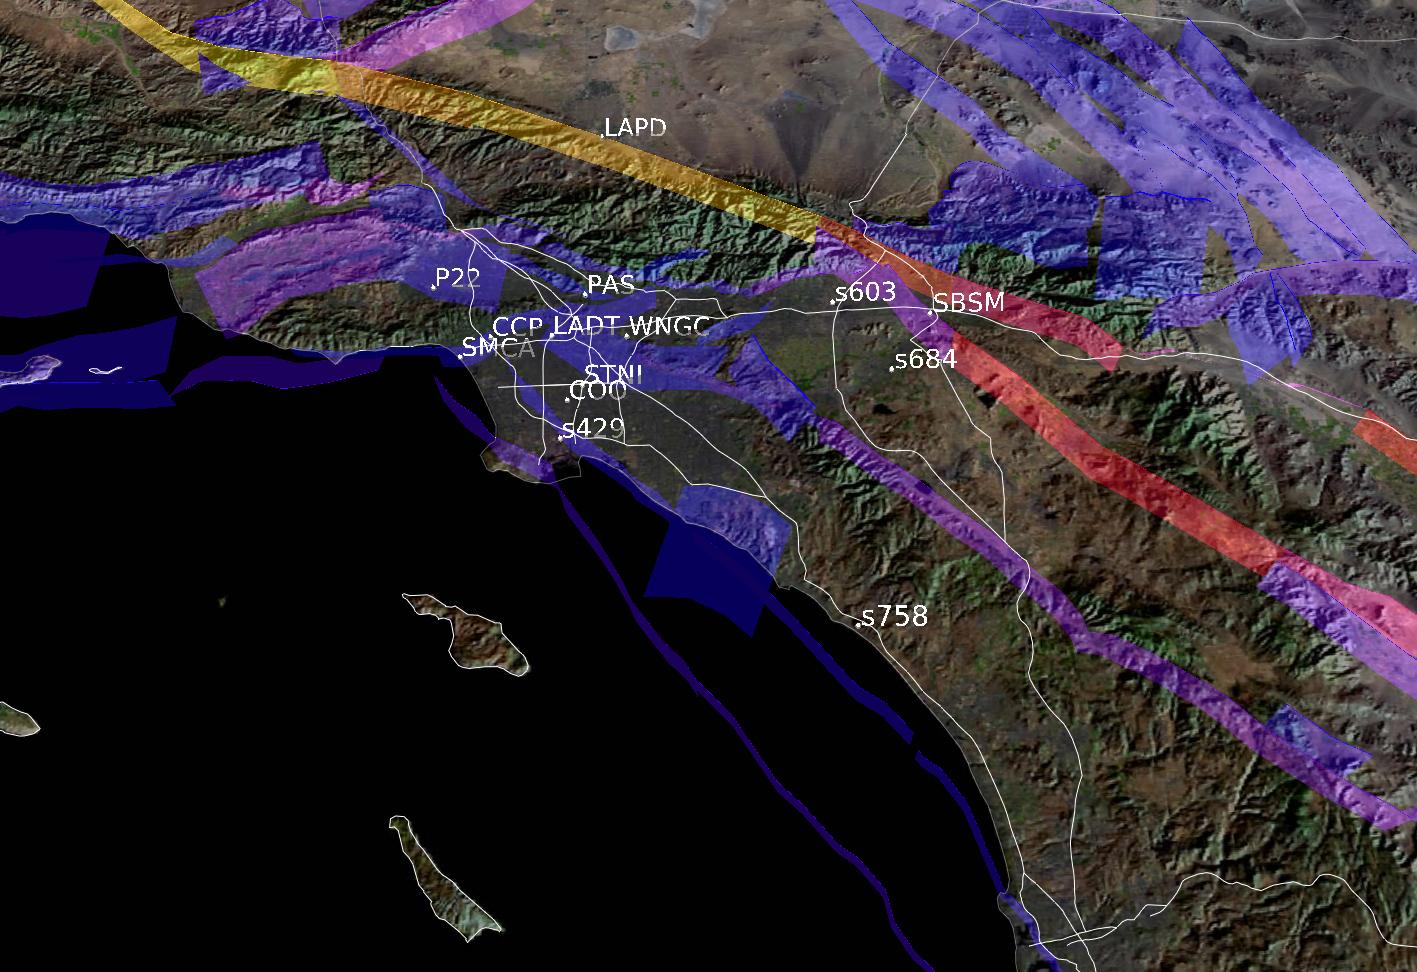
STUDY SITES
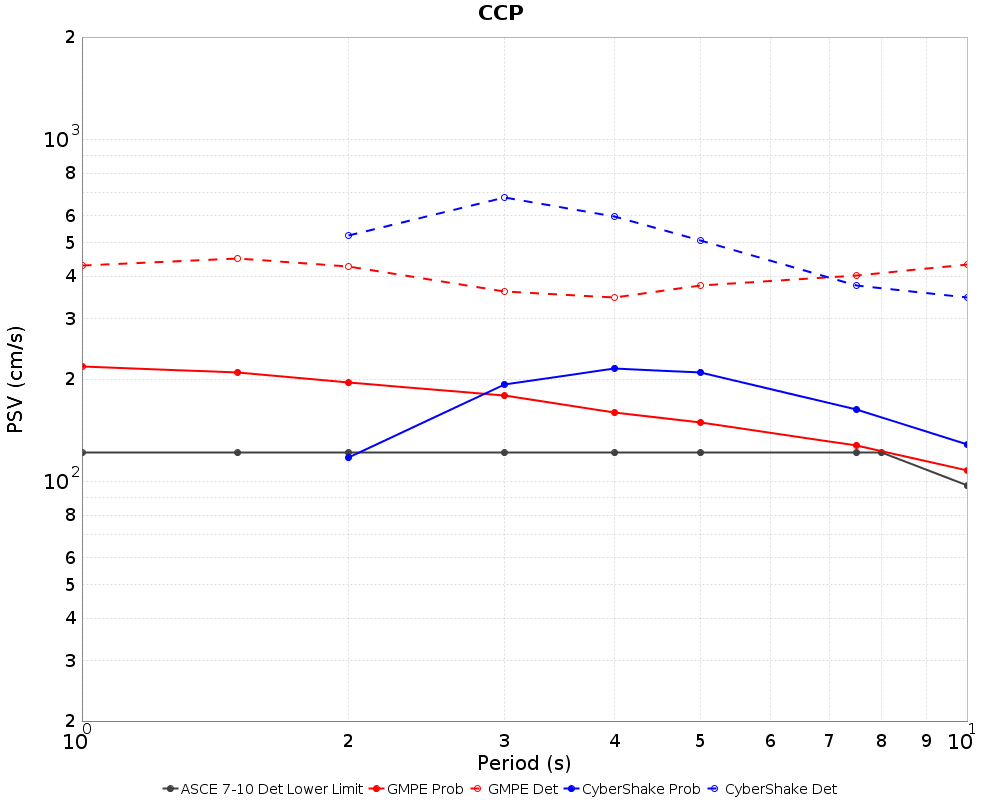
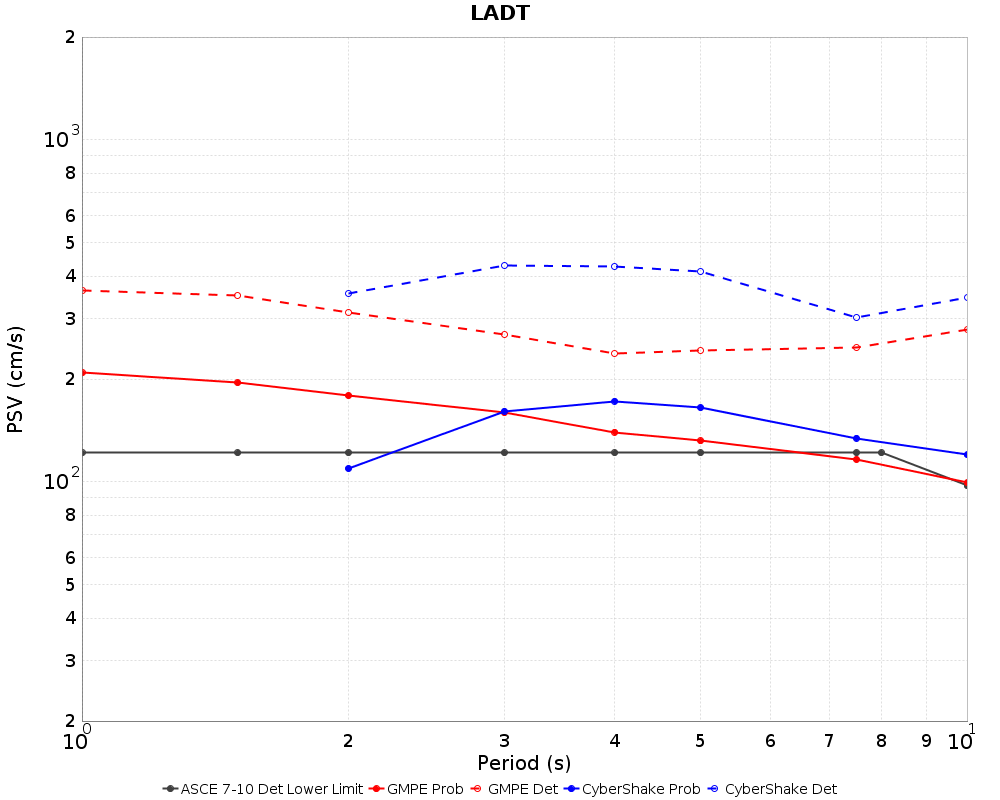
We are calculating MCER results for 14 sites, available in a KML file Image to the right shows the location of the MCER 2014 study sites. These sites can be plotted using the following KML file:
- MCER 2014 Study Sites (Google Earth KML Format). (KML file)
Near surface information about these sites includes Vs30, Z1.0, Z2.5 Values. These values are used in GMPE calculations for these sites. Site names, locations, and near surface values are listed in the following file.
- Site List with Vs30 Information (CSV File)
RESULTS
Plots for each of the 14 sites are available in the following table.
| Site | Deterministic MCER | Combined MCER results | Overall MCER results |
| CCP Century City Plaza |
 |
 |
 |
| 3 COO Compton |
 |
 |
 |
| LADT Los Angeles Downtown |
 |
 |
 |
| LAPD Lake Palmdale |
 |
 |
 |
| P22 |  |
 |
 |
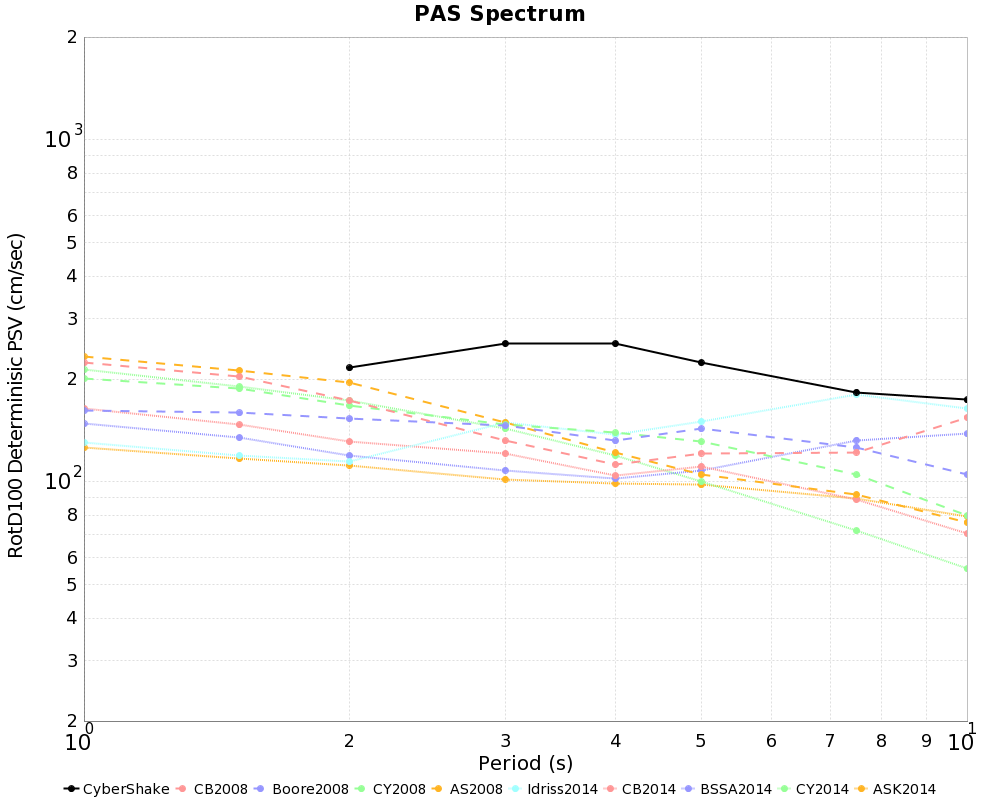
| PAS Pasadena |
 |
 |
 |
| s429 | 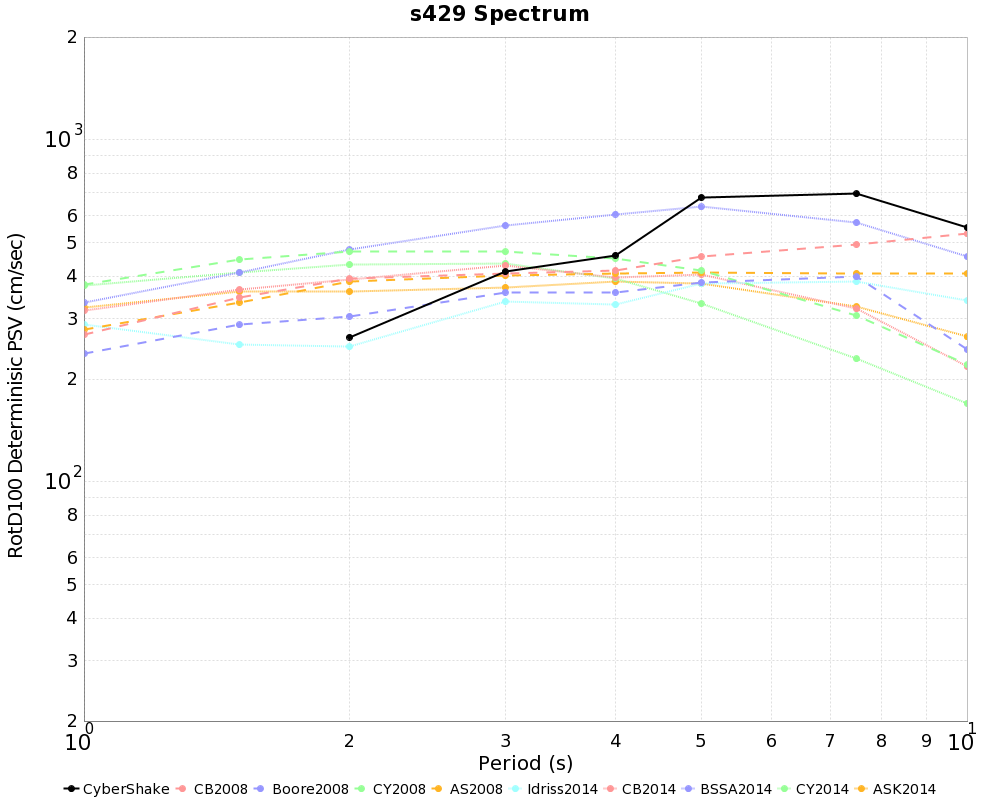 |
 |
 |
| s603 |  |
 |
 |
| s684 |  |
 |
 |
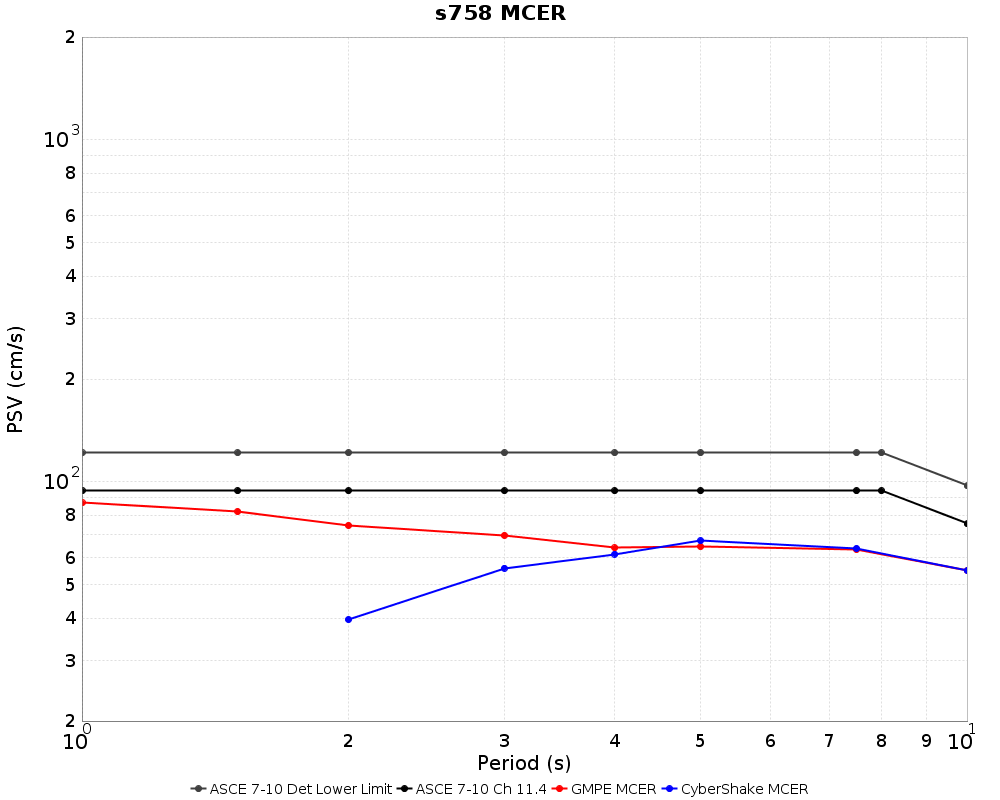
| s758 |  |
 |
 |
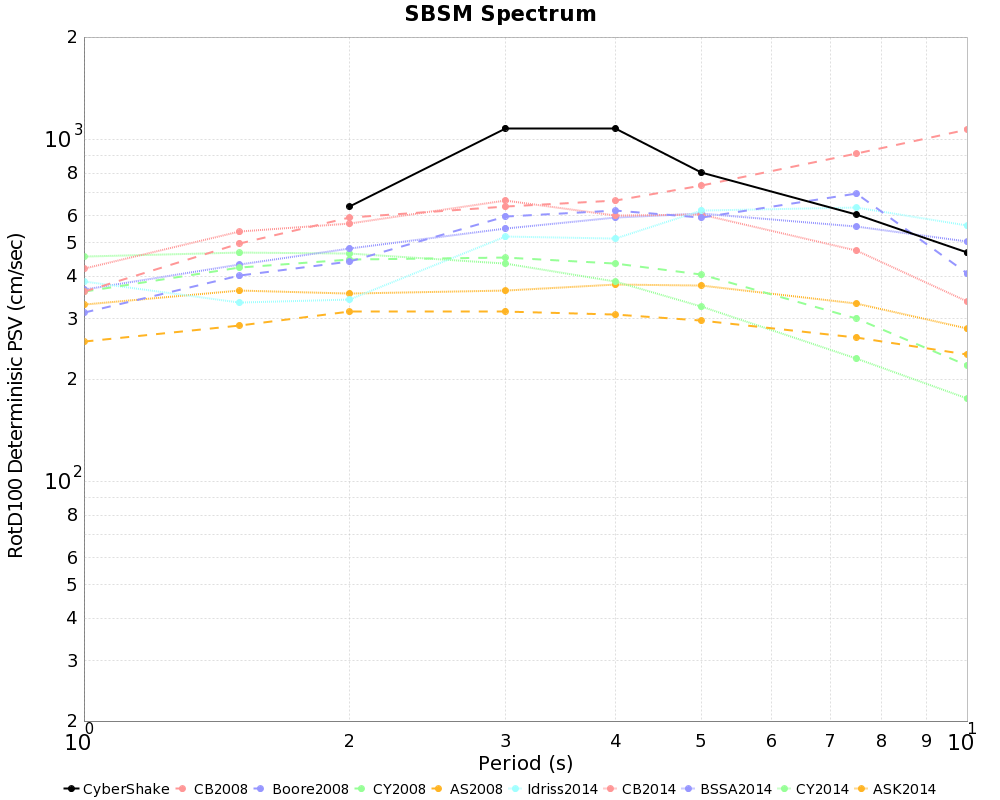
| SBSM San Bernardino Strong Motion |
 |
 |
 |
| SMCA Santa Monica Civic Auditorium |
 |
 |
 |
| STNI 710/90 Interchange |
 |
 |
 |
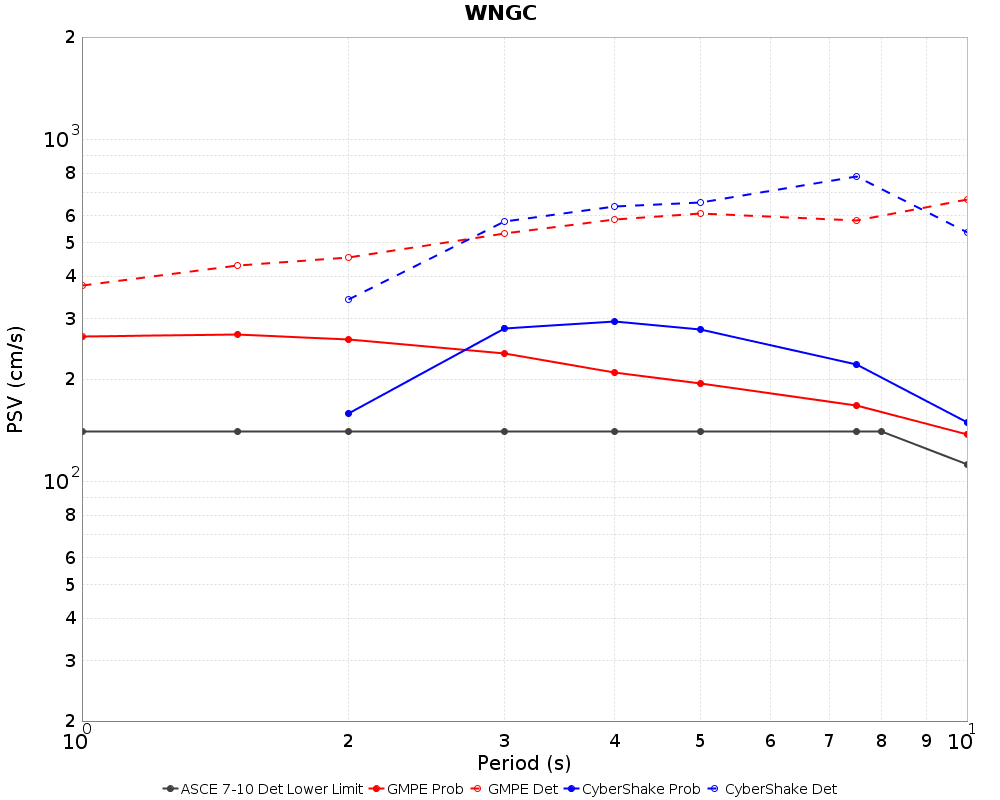
| WNGC Whitter Narrows Golf Course |
 |
 |
 |
More details about each plot type are provided below.
PROBABILISTIC MCER RESULTS
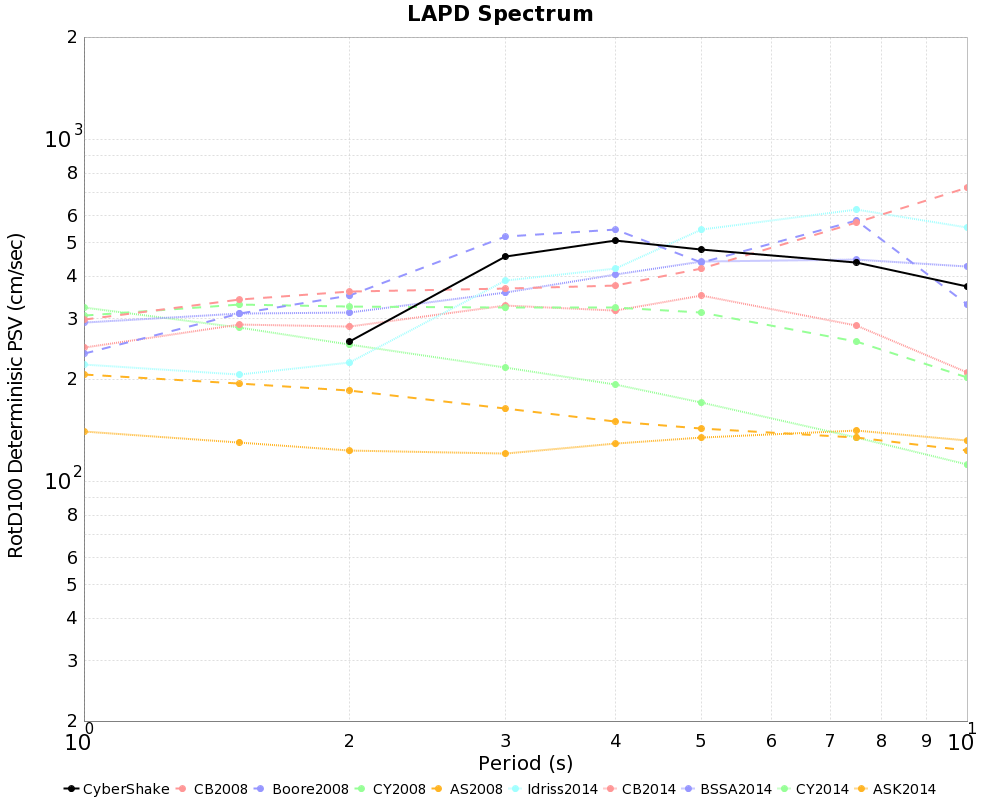
CyberShake probabilistic MCER results for the 14 sites. This also contains comparable RotD100 results for the 2008 and 2014 NGAs.
- Probabilistic MCER Results. (Excel xlsx file)
This zip file contains pseudo spectral velocity plots for the probabilistic results.
- Probabilistic MCER Plots. (815Kb Zip File containing PNG images)
Metadata for these results include:
- CyberShake Model: Study 14.2
- Velocity Model: CVM-S4.26
- Earthquake Rupture Forecast: UCERF2
- Rupture Generator: GP 2010
- Background Seismicity: None
- RotD100 Software: Modified BBP RotD50
- GMPE 2008 GMRotI50 to RotD100 conversion factors: See spreadsheet
- GMPE 2014 RotD50 to RotD100 conversion factors: See spreadsheet
Disaggregation Plots
We disaggregated the CyberShake and NGA hazard curves at 3 seconds and plotted the top 10 contributors for each site. These plots are available here: Disaggregation Plots
Background Seismicity Plots
To determine the impact of background seismicity, we calculated the contributions of on-fault and background seismicity to the NGA hazard curves. These plots are available here: Background Seismicity Contribution Plots
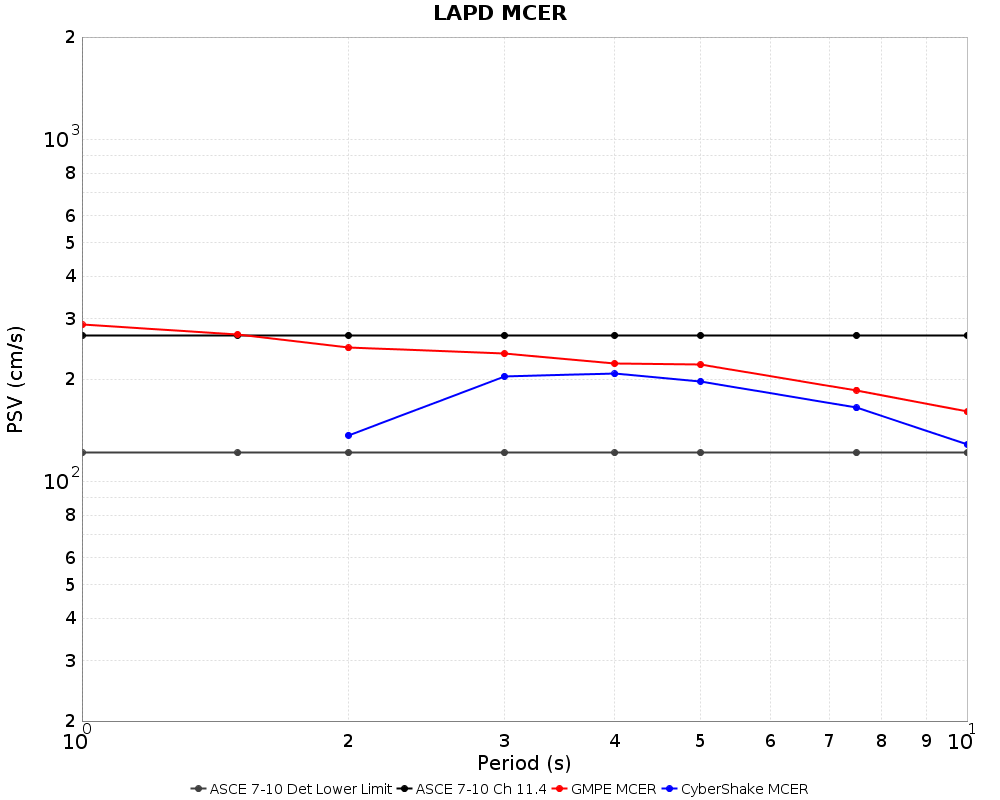
DETERMINISTIC MCER RESULTS
CyberShake deterministic MCER results for the 14 sites, along with comparable results for the 2008 and 2014 NGA models.
- Deterministic MCER Results. (Excel xls file)
This zip file contains pseudo spectral velocity plots for the deterministic results.
- Deterministic MCER Plots. (850Kb zip file containing PNG images)
Metadata for these results include:
- CyberShake Model: Study 14.2
- Velocity Model: CVM-S4.26
- Earthquake Rupture Forecast: UCERF2
- Rupture Generator: GP 2010
- Background Seismicity: None
- RotD100 Software: Modified BBP RotD50
- GMPE 2008 GMRotI50 to RotD100 conversion factors: See probabilistic spreadsheet
- GMPE 2014 RotD50 to RotD100 conversion factors: See probabilistic spreadsheet
COMBINED MCER PLOTS
From the probabilistic and deterministic results, we have produced combined MCER plots of two types, both plotting PSV at periods from 1-10 sec, using the probabilistic and deterministic results previously calculated for the 14 sites identified by the Utilization Committee.
Type A contains 5 curves for each site and are available in a zip file here: All combined plots (~400KB zip file containing PDF, PNG, and TXT files)
- average of the probabilistic NGAs (2014) without Idriss. This was obtained by averaging the 4 NGA hazard curves, then convolving with the fragility function.
- average of the deterministic NGAs (2014) without Idriss
- probabilistic MCER for Cybershake
- deterministic Cybershake
- ASCE 7-10 Det Lower Limit
Type B contains 3 curves for each site and are available in a zip file here: MCER combined plots (~300KB zip file containing PDF, PNG, and TXT files)
- CyberShake: lower of probabilistic MCER and (higher of deterministic and ASCE deterministic lower limit). For CyberShake, the probabilistic is always lower than the deterministic.
- NGA (2014): lower of probabilistic MCER and (higher of deterministic and ASCE deterministic lower limit).
- ASCE 7-10 Ch 11.4
GMPE BACKGROUND SEISMICITY SENSITIVITY
Members of the UGMS committee requested a comparison of probabilistic RTGM spectra for the GMPEs with and without UCERF2 background seismicity included. As CyberShake does not currently consider background seismicity, this to test the assumption that the contribution from background seismicity is negligable in the Los Angeles region. These calculations use the average of the 2014 NGAWest2 GMPEs, excluding Idriss.
Download a zip file with results for all 14 sites here: Media:Gmpe_back_seis_compare.zip.
The result for the LADT site is shown below.

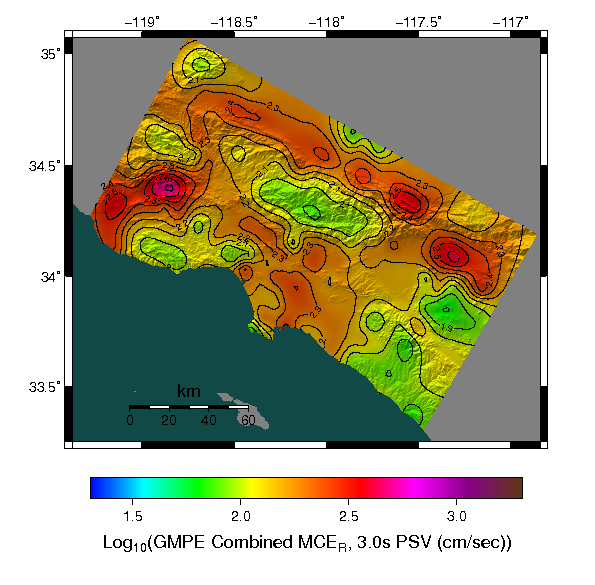
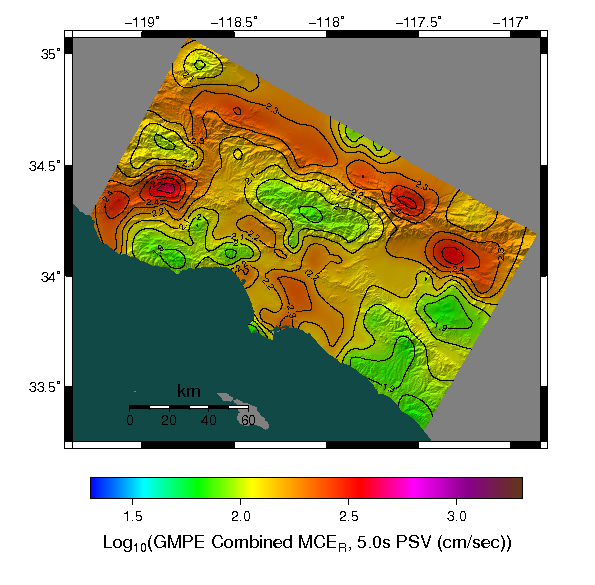
MCER MAPS
CyberShake MCER maps, interpolated between 286 CyberShake sites.
| Period | Probabilistic MCER | Deterministic MCER | Deterministic Lower Limit | Combined MCER results |
| 3 Second, RotD100 |  |
 |
 |
 |
| 5 Second, RotD100 |  |
 |
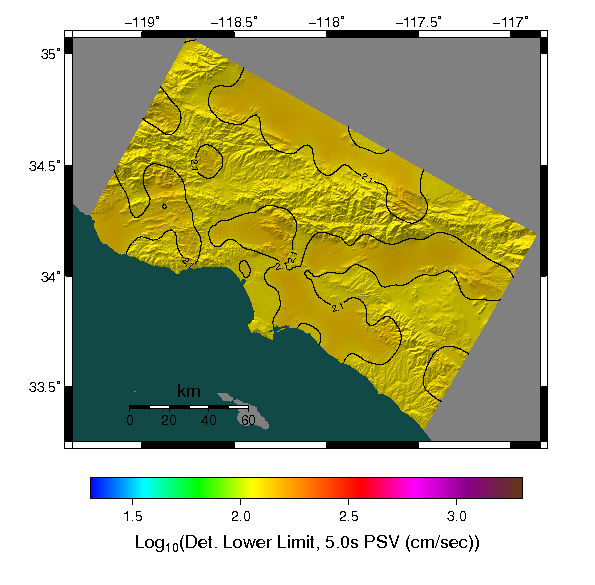 |
 |
| 10 Second, RotD100 |  |
 |
 |
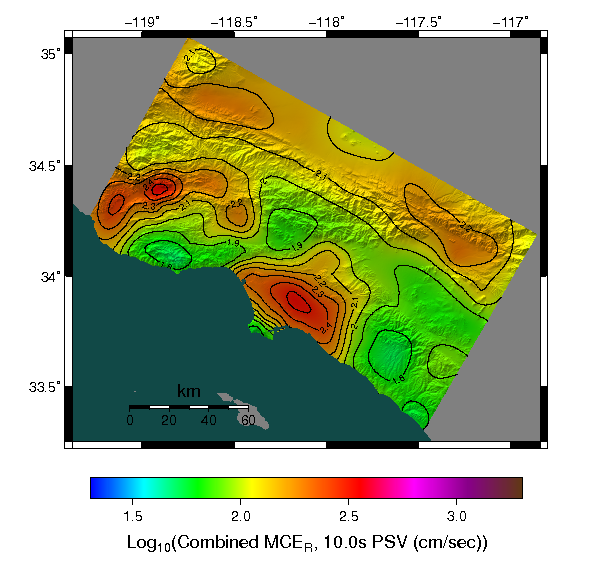 |
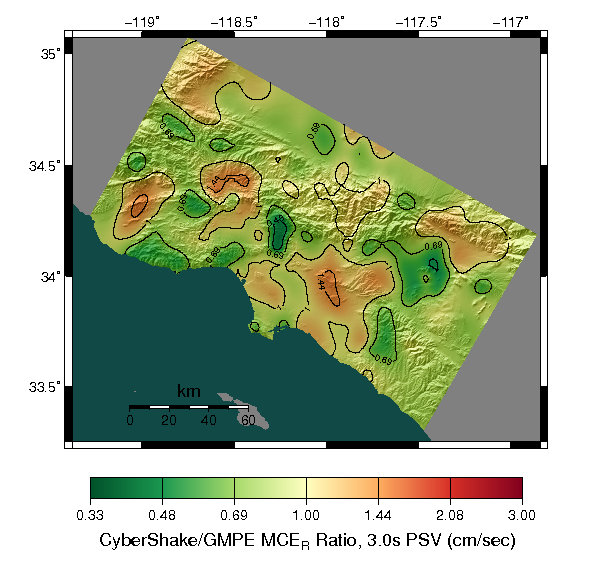
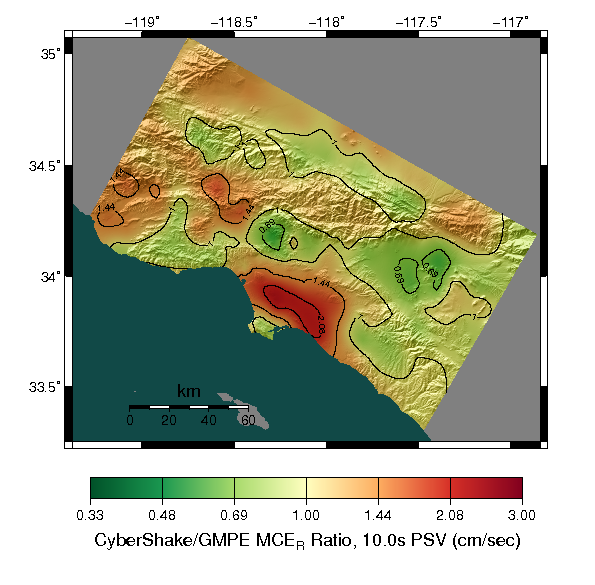
GMPE COMPARISONS
| Period | CyberShake Combined MCER | GMPE Combined MCER |
Ratio (CyberShake/GMPE) |
| 3 Second, RotD100 | |
 |
 |
| 5 Second, RotD100 | |
 |
 |
| 10 Second, RotD100 | |
 |
 |


