For those interested in the SCEC Community Fault Model (CFM) project and contributing, this background page offers essential information to get started.
The SCEC Community Fault Model (CFM) is a community-developed effort that has evolved since the mid‑2000s to provide a comprehensive, fully 3D geometric representation of active faults in California and adjacent offshore basins. The table below summarizes the evolution of the SCEC CFM since 2006. The current release spans the Pacific–North American plate boundary from northern Mexico to the southern Cascadia subduction zone, extending the model to all of California. CFM fault geometries and metadata synthesize diverse constraints—including surface fault traces, seismicity, seismic‑reflection profiles, well data, and geologic cross sections—into triangulated 3D fault surfaces. When used alongside the Community Velocity Model (CVM), the CFM contributes to a unified structural representation of crust and upper mantle structure that supports more realistic 3D earthquake simulations, strengthening ground‑motion studies, hazard assessments, and research on how ruptures initiate and propagate through complex Earth structure.
Community Evaluation and Objective Analyses: The SCEC CFM is evaluated through a recurring, community-driven open review process that targets fault geometries where alternative interpretations could materially influence seismic hazard. For example, prior to assembling CFM 6.0 (and later CFM 7.0), SCEC convened an open and rigorous evaluation of CFM 5.3 in April–May 2022, focusing on 23 fault representations where competing structural interpretations could significantly affect hazard estimates. Expert scoring and ranking were used to identify which representations should become part of the preferred model, resulting in 14 new preferred representations in CFM 6.0. Lower-ranked interpretations were retained and distributed as formal alternatives to preserve uncertainty and enable sensitivity analyses.
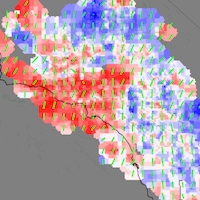
In parallel with expert review, CFM developers apply objective, data-driven checks to assess model completeness and performance. A key approach is the statistical earthquake–fault association method of Evans et al. (2020), which links earthquakes to candidate CFM faults using independent information to estimate the most likely source fault(s). These results enable quantitative comparisons of how well the latest CFM explains past seismicity relative to earlier CFM versions and other fault inventories, helping to identify potentially missing, mislocated, or oversimplified structures and to guide priorities for future revisions.
SCEC CFM Contributors: The SCEC CFM is a community resource made possible through the sustained efforts, data, and expertise of many collaborators. We gratefully acknowledge the following CFM contributors:
Christine Benson, William Bryant, Sara Carena, Michele Cooke, James Dolan, Jessica Don, Gary Fuis, Eldon Gath, Russell Graymer, Judith Hubbard, Susanne Janecke, Sam Johnson, Yuval Levy, Lisa Grant Ludwig, Egill Hauksson, Thomas Jordan, Marc Kamerling, Keith Knudsen, Mark Legg, Scott Lindvall, Harold Magistrale, James Lienkaemper, Scott Marshall, Craig Nicholson, Nathan Niemi, Stu Nishenko, Michael Oskin, Sue Perry, George Planansky, Andreas Plesch, Thomas Rockwell, David Schwartz, John Shaw, Peter Shearer, Bob Simpson, Christopher Sorlien, M. Peter Süss, John Suppe, Jerry Treiman, Jeff Unruh, Janet Watt, Franklin Wolfe, Chris Wills, Robert Yeats, and every colleague who has participated in a CFM community evaluation.
Contributing New Fault Data: To keep future CFM releases current and well constrained, the CFM relies on input from the SCEC community—especially newly published observations that refine 3D fault geometry in California and adjacent regions. If you have new data (or know of recent work) that should be considered, please submit it using the SCEC CFM Model Contribution Form. Because building and validating 3D fault representations is not automated and requires substantial effort, submitted materials may be reviewed and incorporated in a subsequent major release rather than immediately.

Community Fault Model (CFM)
3D geometric representations of faults in California
CFM is an object-oriented, 3D representation of active faults in California, including geometries, depths, and slip potential. Explore and download data for use in fault system modeling, seismic hazard analyses, and many other applications.
Community Stress Model (CSM)
suite of stress and stressing rate models
The CSM provides estimates of stress and stressing rates for various regions of California. The suite of models, derived using a variety of methods and datasets, are presented on a consistent grid.

Unified Community Velocity Model (UCVM)
software for accessing seismic velocity models
A standard interface to multiple seismic velocity models that can be used to create velocity meshes for 3D wavefield simulations. UCVM is used by researchers working with Earth material properties on regional or local scales.
Community Geodetic Model (CGM)
Earth surface displacement from GNSS and InSAR
The CGM integrates high-precision GNSS and InSAR data to provide velocities and time series of Earth’s surface movements. Data comes from a number of contributing researchers, institutions and analysis centers.

Community Rheology Model (CRM)
3D ductile rheology of lithosphere in California
The CRM provides a detailed, physics-based 3D model of ductile rheology (rock flow) for Southern California’s lithosphere. The explorer provides an interface to query temperature, pressure, and rheology data.

Community Thermal Model (CTM)
estimates of temperature and thermal properties
The CTM provides estimates of temperatures and thermal properties of the southern California lithosphere and asthenosphere. Currently, the CTM includes two models, each based on different methods.

Geologic Slip Rate Database (GSRD)
geologic slip rates for CA, NV, and northern Mexico
SCEC’s GSRD centralizes field-derived geologic slip rates crucial for seismic hazard estimates (e.g., NSHM), linked to relevant source publications. As a living archive, it welcomes updates via a user submission form.

Precariously Balanced Rock (PBR) Database
field-derived data for PBRs in California
The database contains photographs, locations, and metadata for PBRs, valuable for constraining seismic hazard estimates and validating ground motion predictions. An interactive map viewer facilitates data exploration and querying.
CEMs are collaborative platforms featuring community-contributed data, models, and tools for earthquake system analysis. CEMs enable 3D visualization, data exploration, sharing, and integrated analyses.
The SCEC Community Fault Model (CFM) is an object‑oriented, fully 3D representation of active faults in California and adjacent offshore basins, spanning the plate boundary from northern Mexico to the southern Cascadia subduction zone. For each fault, the CFM provides triangulated fault surfaces (t‑surfs) at multiple resolutions, fault traces in standard formats (shapefiles, GMT text, and Google Earth KML), and comprehensive metadata with the supporting references.
SCEC Community Fault Model (Version 7.0) by Plesch et al. (2024).
| Version | Release Year | Total Fault Objects | SCEC CFM Sub-Models | Model Release Notes |
|---|---|---|---|---|
| 2024 | Including sub-models, comprises 608 fully documented fault objects | CFM 7.0 Preferred: 556 fault objects representing current active faults CFM 7.0 Ruptures: 13 fault objects involved in selected significant historic events CFM 7.0 Alternatives: 39 proposed alternative structural representations that could significantly impact fault mechanics and associated seismic hazards | CFM 7.0 now provides statewide coverage of California’s active faults, extending from northern Mexico to the southern Cascadia subduction zone. This release introduces 113 new fault representations in central and northern California. The southern California portion remains unchanged from CFM 6.1. The CFM Earthquake‑to‑Fault Association Service now integrates with the SCEC CFM Explorer, enabling interactive visualization of associated faults and earthquakes. Notification emails include direct links to CFM 7.0 fault traces, most‑likely fault surfaces, and event hypocenters. | |
| CFM 6.1 | 2023 | Including sub-models, comprises 494 fully documented fault objects | CFM 6.1 Preferred: 443 fault objects representing current active faults CFM 6.1 Ruptures: 13 fault objects involved in selected significant historic events CFM 6.1 Alternatives: 38 proposed alternative structural representations that could significantly impact fault mechanics and associated seismic hazards | CFM 6.0 is built from a comprehensive community evaluation of CFM 5.3 and introduces fully documented “ruptures” and “alternatives” sub‑models that capture competing structural interpretations with potential impacts on hazard estimates. CFM 6.0 features 37 new or revised fault representations, drawing on SCEC‑sponsored fault studies using relocated earthquake catalogs, ML‑enabled catalogs, focal mechanisms, and surface geology (e.g., Nicholson et al., 2021; Hauksson et al., 2020; Ross et al., 2019; Plesch et al., 2020). Major updates include refinements for faults in the 2019 Ridgecrest epicentral zone, the Salton Sea region, Santa Monica Bay, the Los Angeles Basin, the Ventura Basin, and the Santa Barbara Channel. CFM Explorer now supports uploading georegistered images and data in .kml/.kmz format. |
| CFM 5.3 | 2022 | Including sub-models, comprises 1,189 fully documented fault objects | CFM 5.3 Preferred: 442 fault objects representing current active faults CFM 5.3 Alternatives: 747 alternative CFM5.3 fault representations not included in the preferred model | More than 60 new fault representations were added from SCEC investigators (Plesch et al., 2019, 2020; Nicholson et al., 2020), including detailed models of the source faults and surrounding structures for the 2019 Ridgecrest earthquake sequence and offshore regions. CFM 5.3 is also integrated into the volumetric SCEC Geologic Framework Model (GFM) for improved cross‑model consistency. Associated products were expanded to include updated fault traces (now also in .kml) and regularized surface meshes at 500 m, 1000 m, and 2000 m resolutions. All Preferred CFM 5.2 faults now have downloadable regularized meshes. A new CFM website and Explorer Tool were developed, enabling search by region or orientation and providing interactive 3D visualization of fault representations. Major database enhancements include automated accuracy and consistency checks and expanded metadata fields (area‑weighted strike/dip, surface area, primary slip sense, and references used to define fault geometry). Metadata spreadsheets are also available for download. |
| CFM 5.2 | 2017 | Including sub-models, comprises 1,080 fully documented fault objects | CFM 5.2 Preferred: 386 fault objects representing current active faults CFM 5.2 Alternatives: 694 alternative CFM5.2 fault representations not included in the preferred model | CFM 5.0 includes 90 fault zones defined by 300+ named faults, with more than 350 new or updated representations added since v3.0. CFM 5.2 adds further updated fault representations (Nicholson et al., 2017) and expands the database to include updated Mojave faults, detailed offshore Borderland structures, and new alternatives for the Ventura Special Fault Study Area. The CFM 5.2 geometry is also linked to UCERF3 slip‑rate data and incorporates remeshed surfaces to support earthquake simulator modeling. The updated hierarchical database improves internal consistency and maintainability, adds to the comprehensive metadata (versioning, descriptors, QFault IDs, fault attributes), and aligns fully with the t‑surf model catalog. |
| CFM 4 | 2014 | Including sub-models, comprises 342 fully documented fault objects | CFM 4 Preferred: 254 fault objects representing current active faults CFM 4 Alternatives: 88 alternative CFM4 fault representations not included in the preferred model | Revisions incorporate the USGS QFault trace database with emphasis on San Gorgonio Pass and Ventura basin areas. Archive includes poster and a fault database spreadsheet with USGS QFault IDs and quality factors used to rank alternatives and define the preferred set. |
| CFM 3 | 2006 | Including sub-models, comprises 394 fully documented fault objects | CFM 3 Preferred: 165 fault objects representing current active faults CFM 3 Alternatives: 229 alternative CFM4 fault representations not included in the preferred model | Over 140 active faults—including the San Andreas fault (SAF), the Eastern California Shear Zone (ECSZ), and blind-thrust faults in the Los Angeles Basin (as described in Plesch et al., 2007)—were evaluated. This effort produced the first fully evaluated CFM and established a framework for selecting a preferred fault model and ranking alternative representations. |
Interactive 3D CFM Explorer Tool
Explore the SCEC Community Fault Model (CFM) without downloading the full archive. The CFM Explorer is a web-based viewer that lets you browse faults in an interactive map and easily launch 3D visualizations using the PLOT3D option. Browse across model releases and associated submodels where available. As you explore, you can select faults, view key metadata, and download only the fault geometry you need. Users can upload their own data in kml/kmz files for direct comparison with the CFM and recent seismicity can be queried and visualized from USGS ComCat. The SCEC CFM Explorer also includes supporting pages (user guide, citation guidance, a disclaimer, and contact details) to help you use the CFM appropriately and reference it correctly.
Explorer Tutorial: 2D Map View
Explorer Tutorial: Plot3D
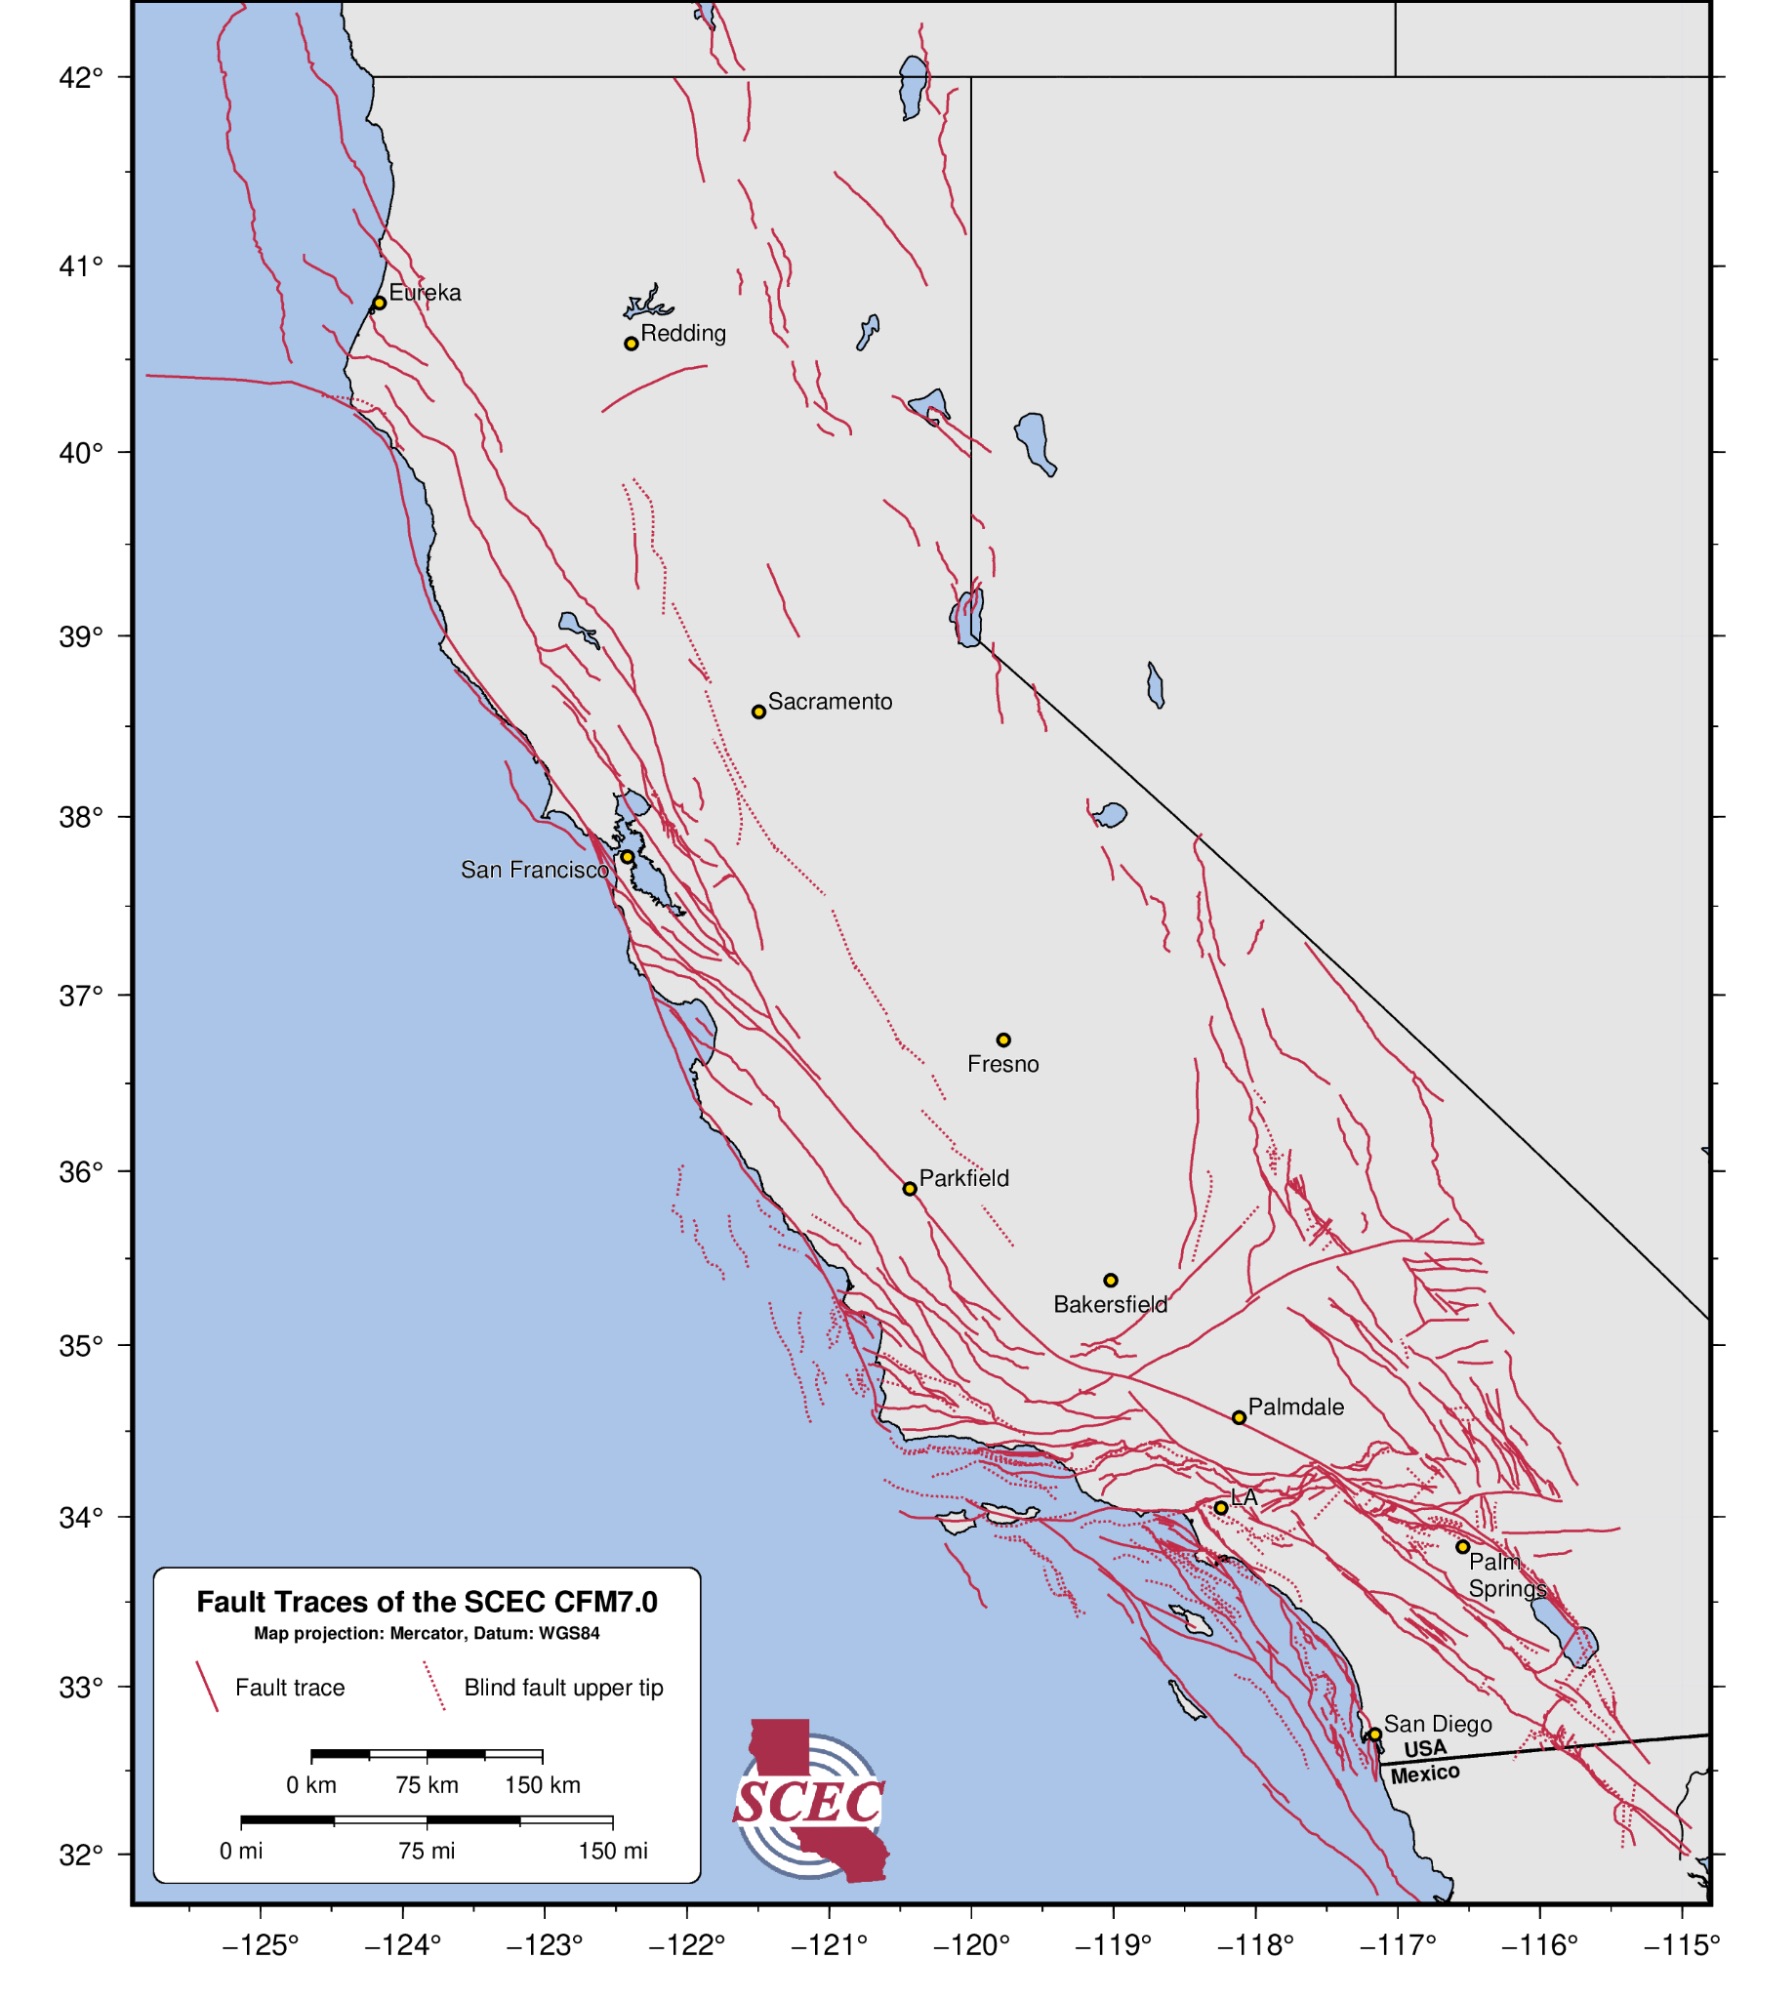
2D Fault Trace Maps
Although the CFM is a fully three-dimensional subsurface model, it’s often helpful to view faults in a familiar 2D map context—for example, to compare fault locations with topography, coastlines, and other geographic features. If you’d like to make your own maps, CFM fault-trace data are available in shapefile, Google Earth KML, and GMT multi-segment ASCII formats, and can be found in the CFM DOI archive under obj/preferred/traces (and related subdirectories). Here are example 2D fault trace maps that use elevation and bathymetry from USGS 3DEP and GMRT, produced with the open-source Generic Mapping Tools (GMT) package:
no topography
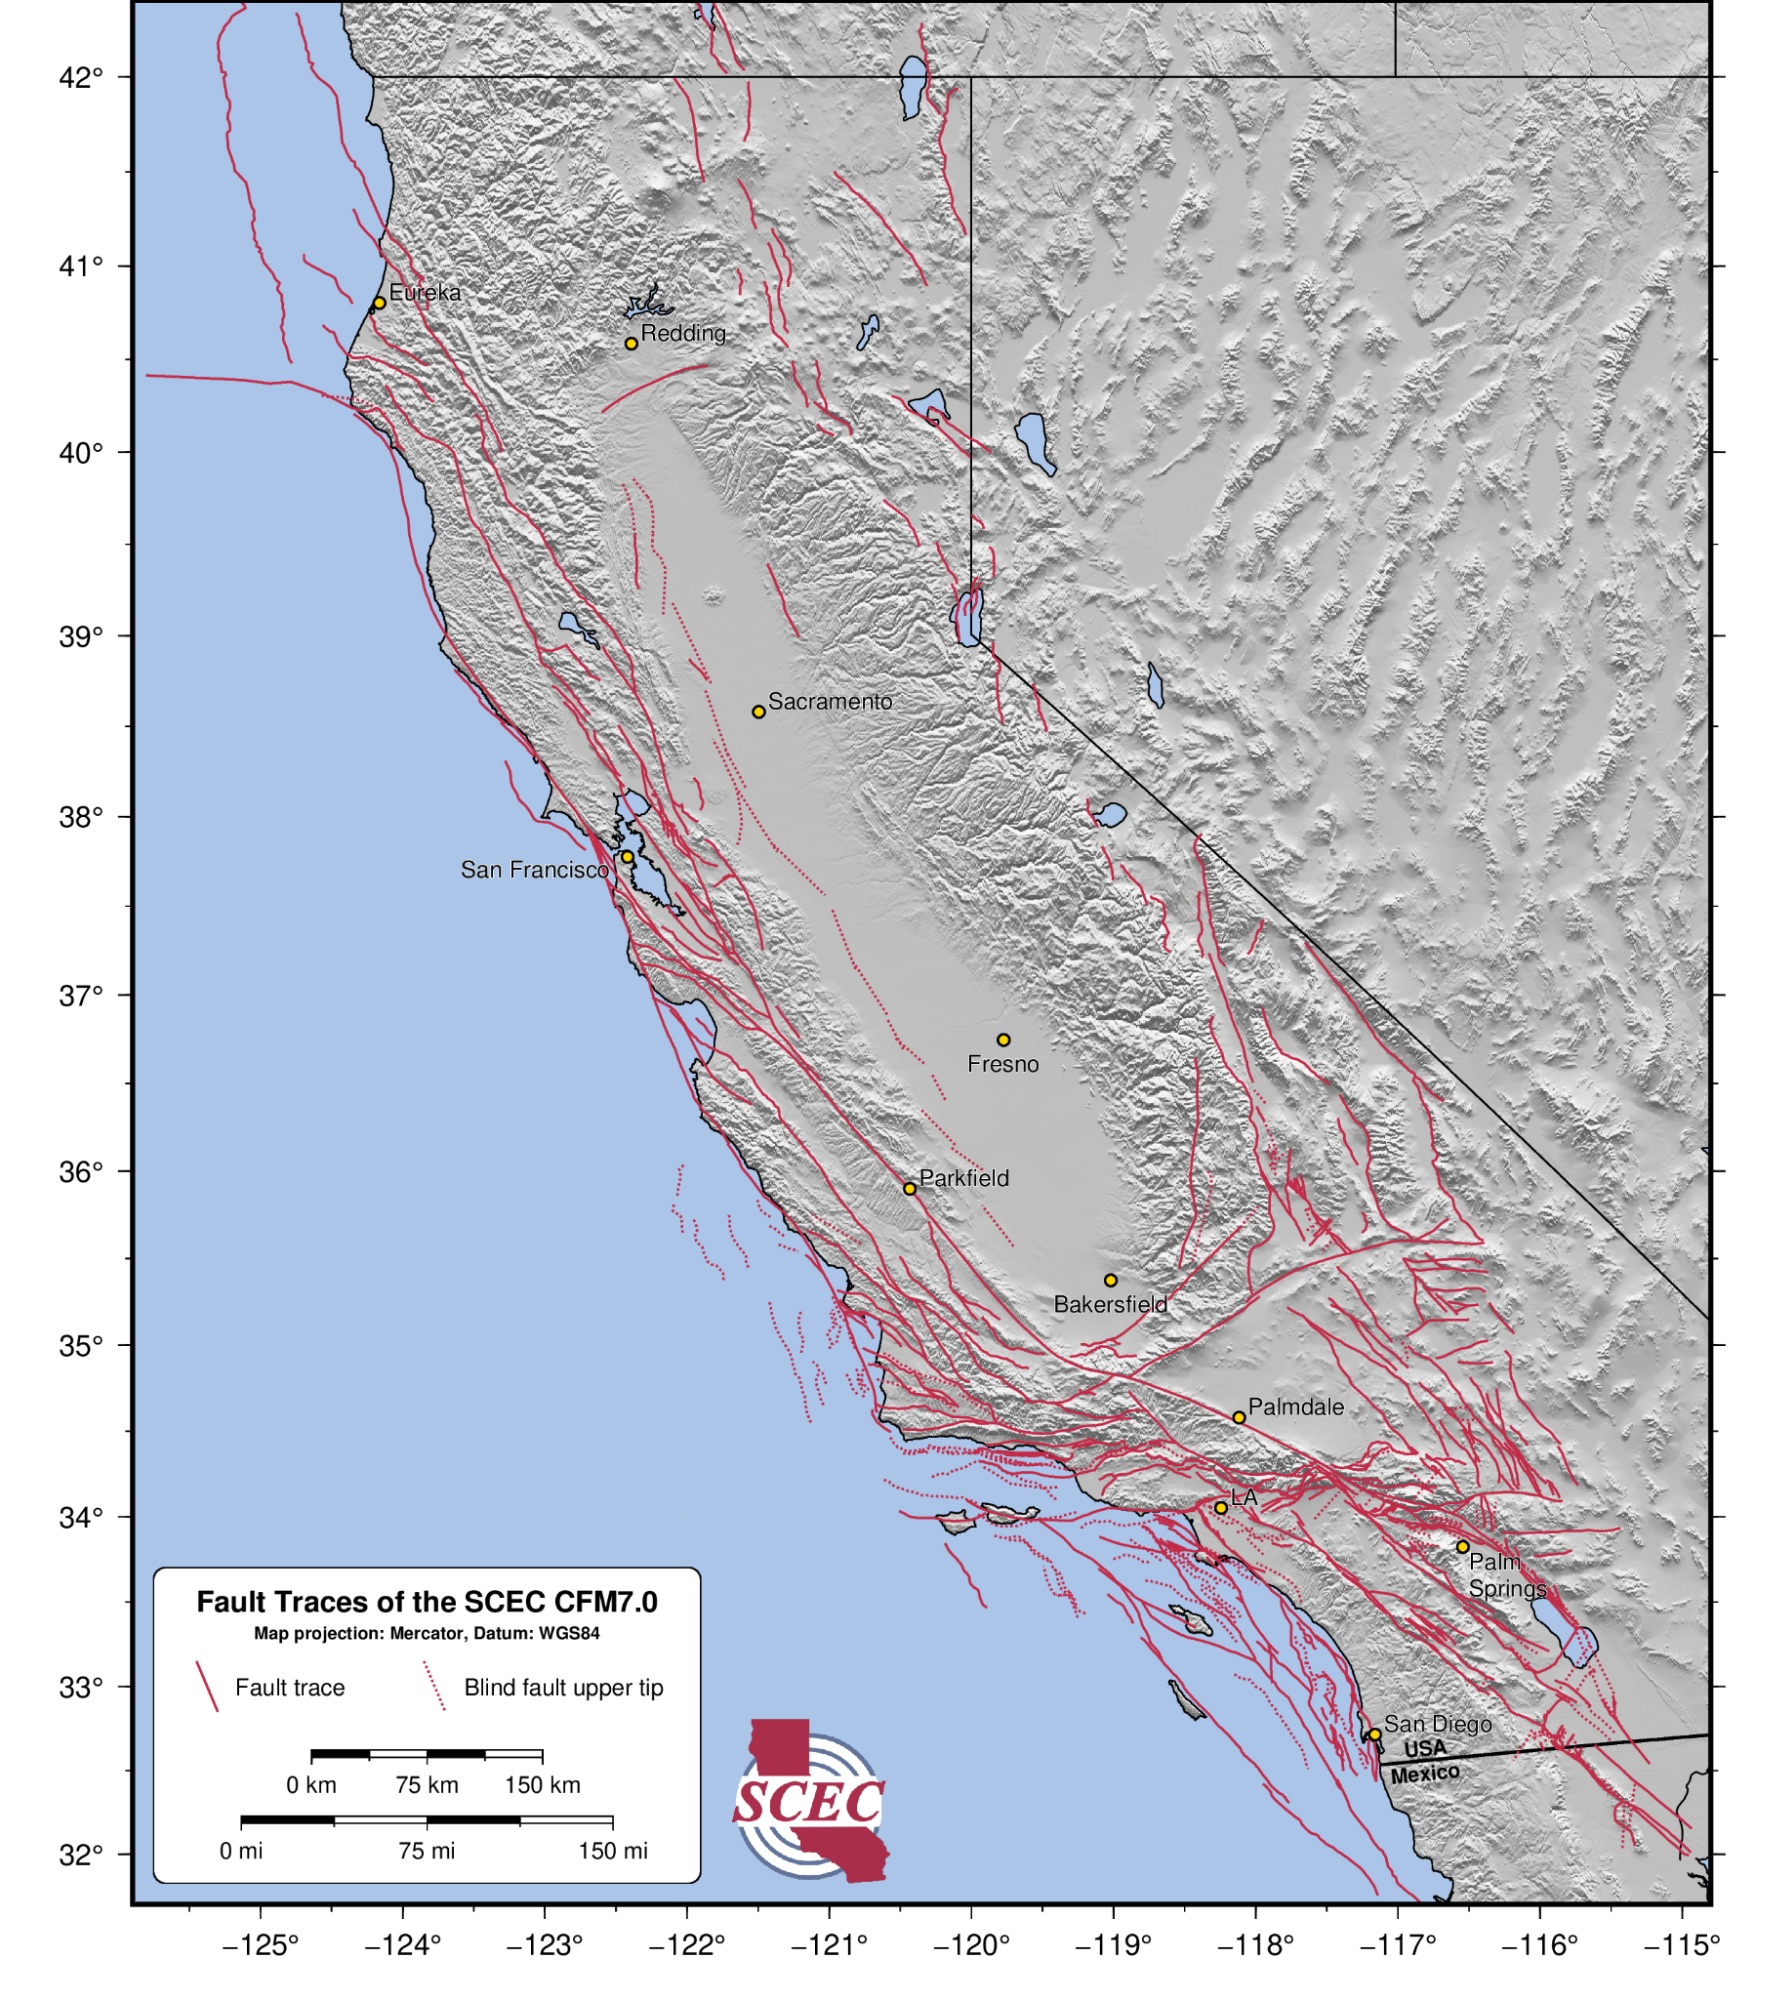
shaded DEM, grayscale
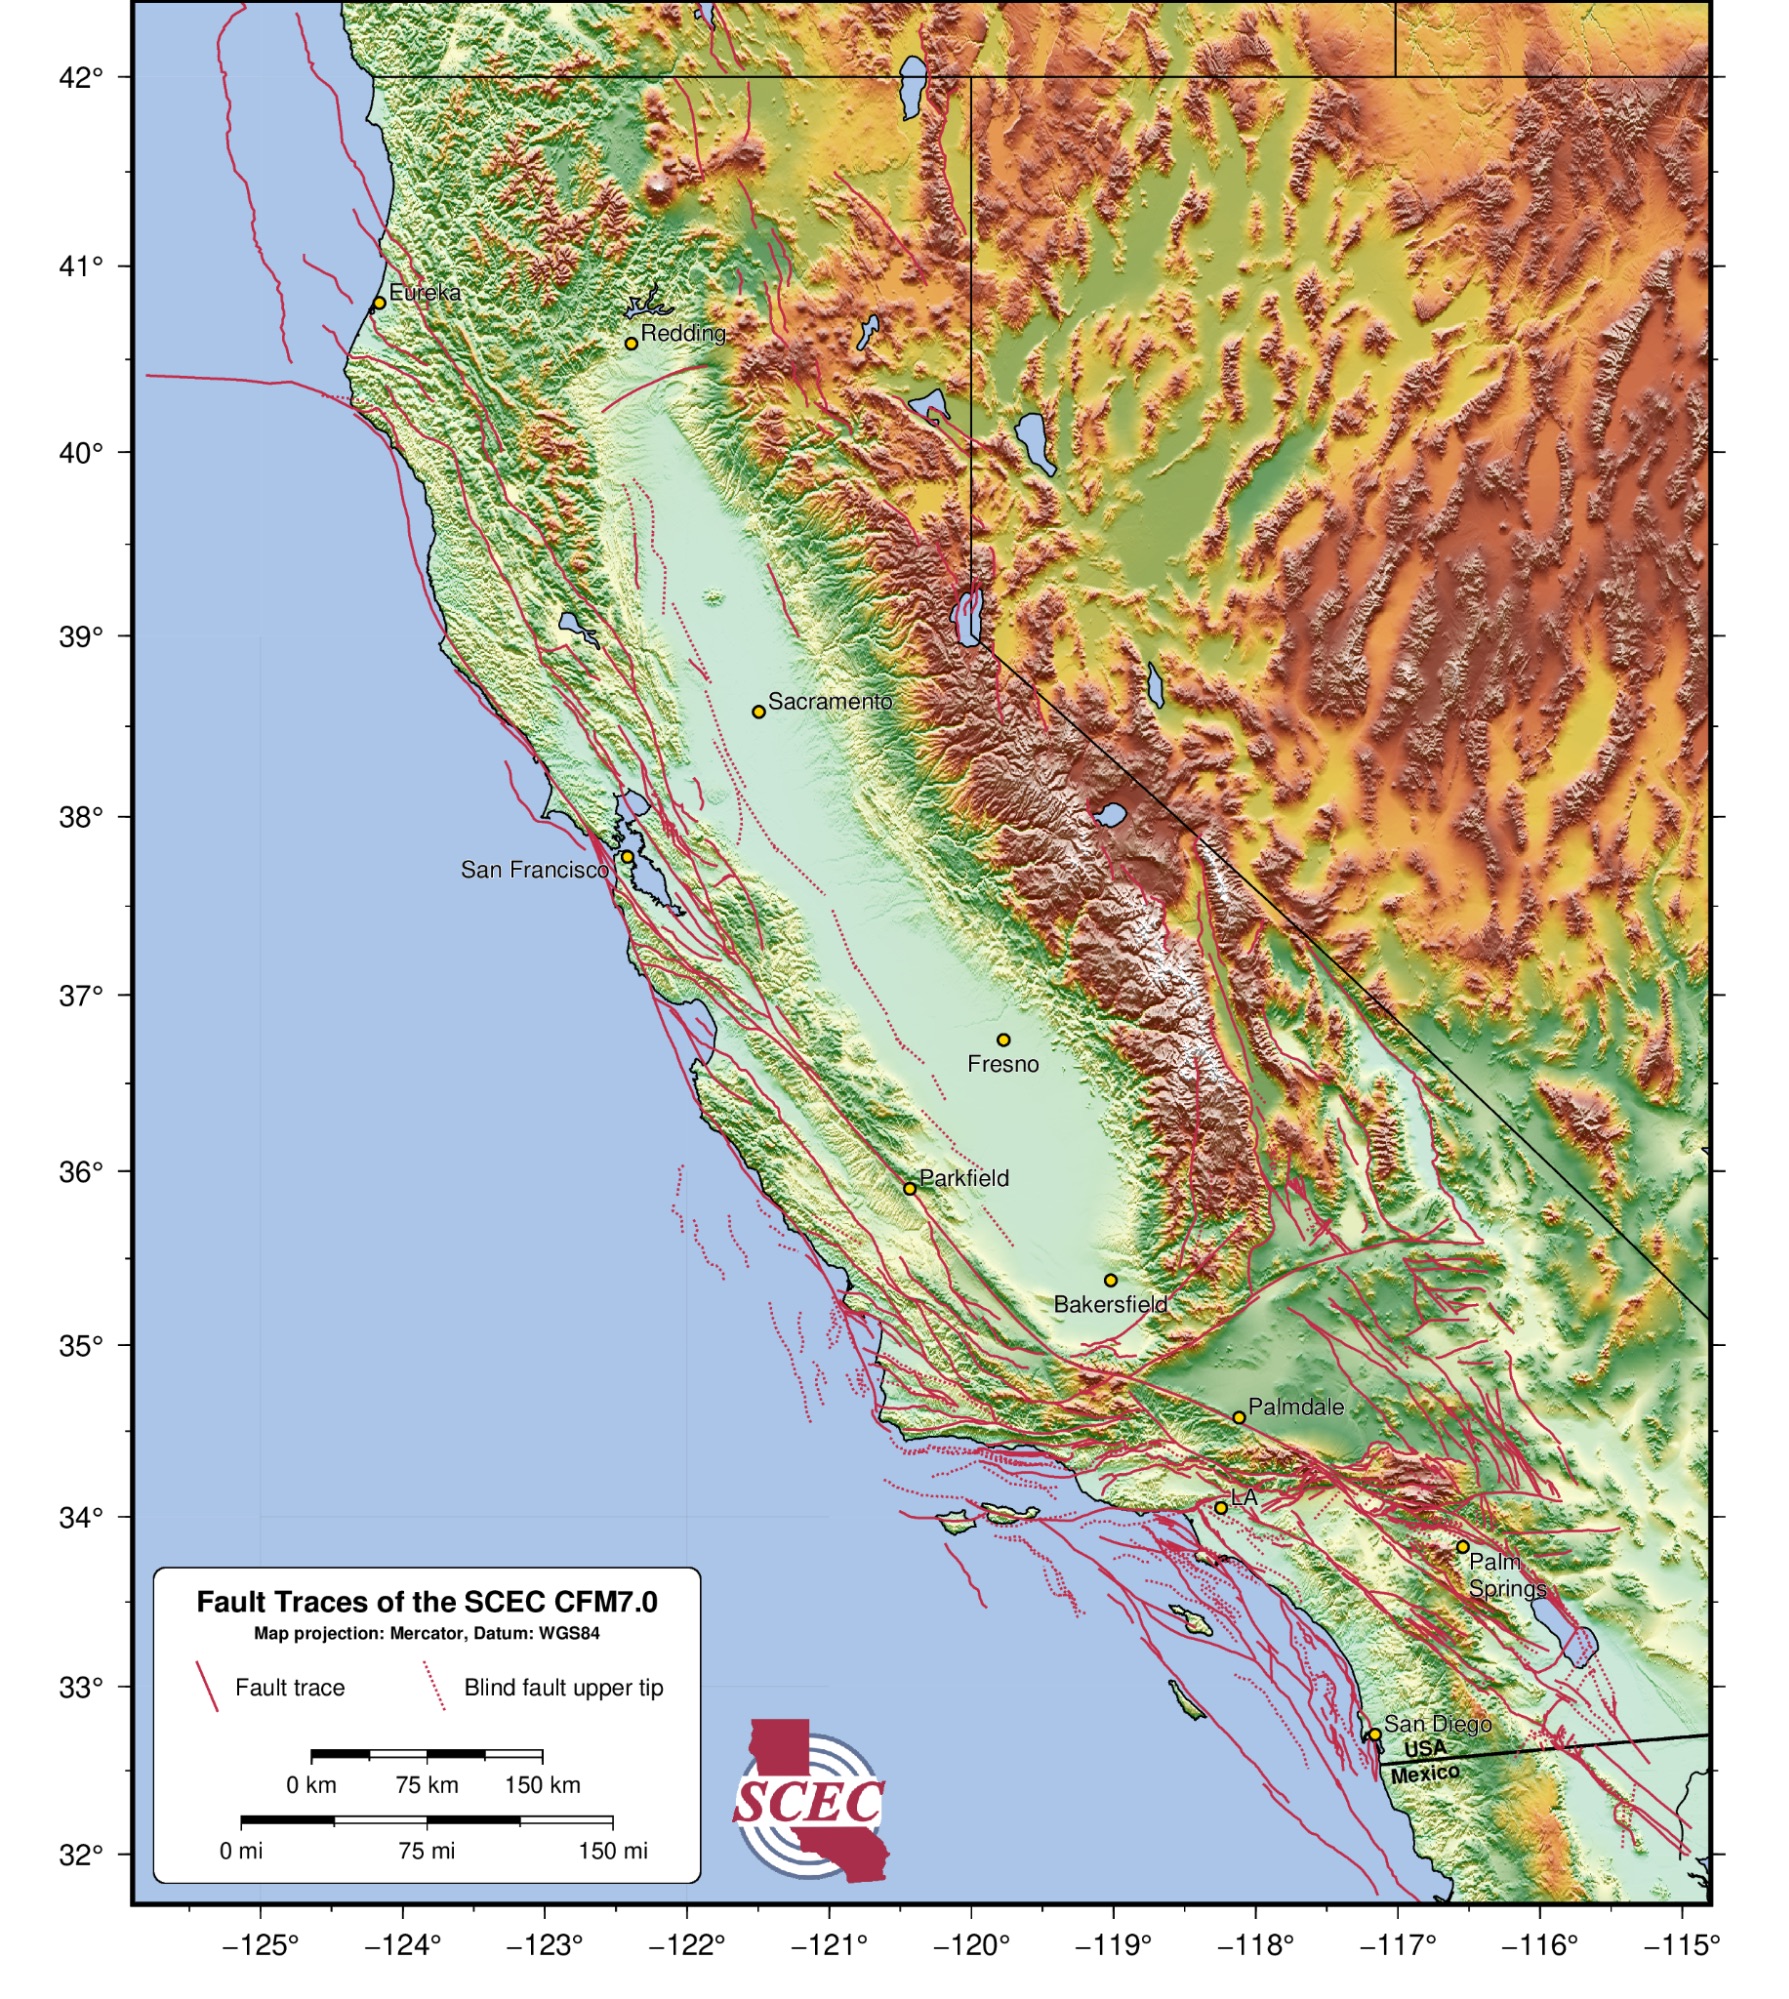
shaded DEM, color
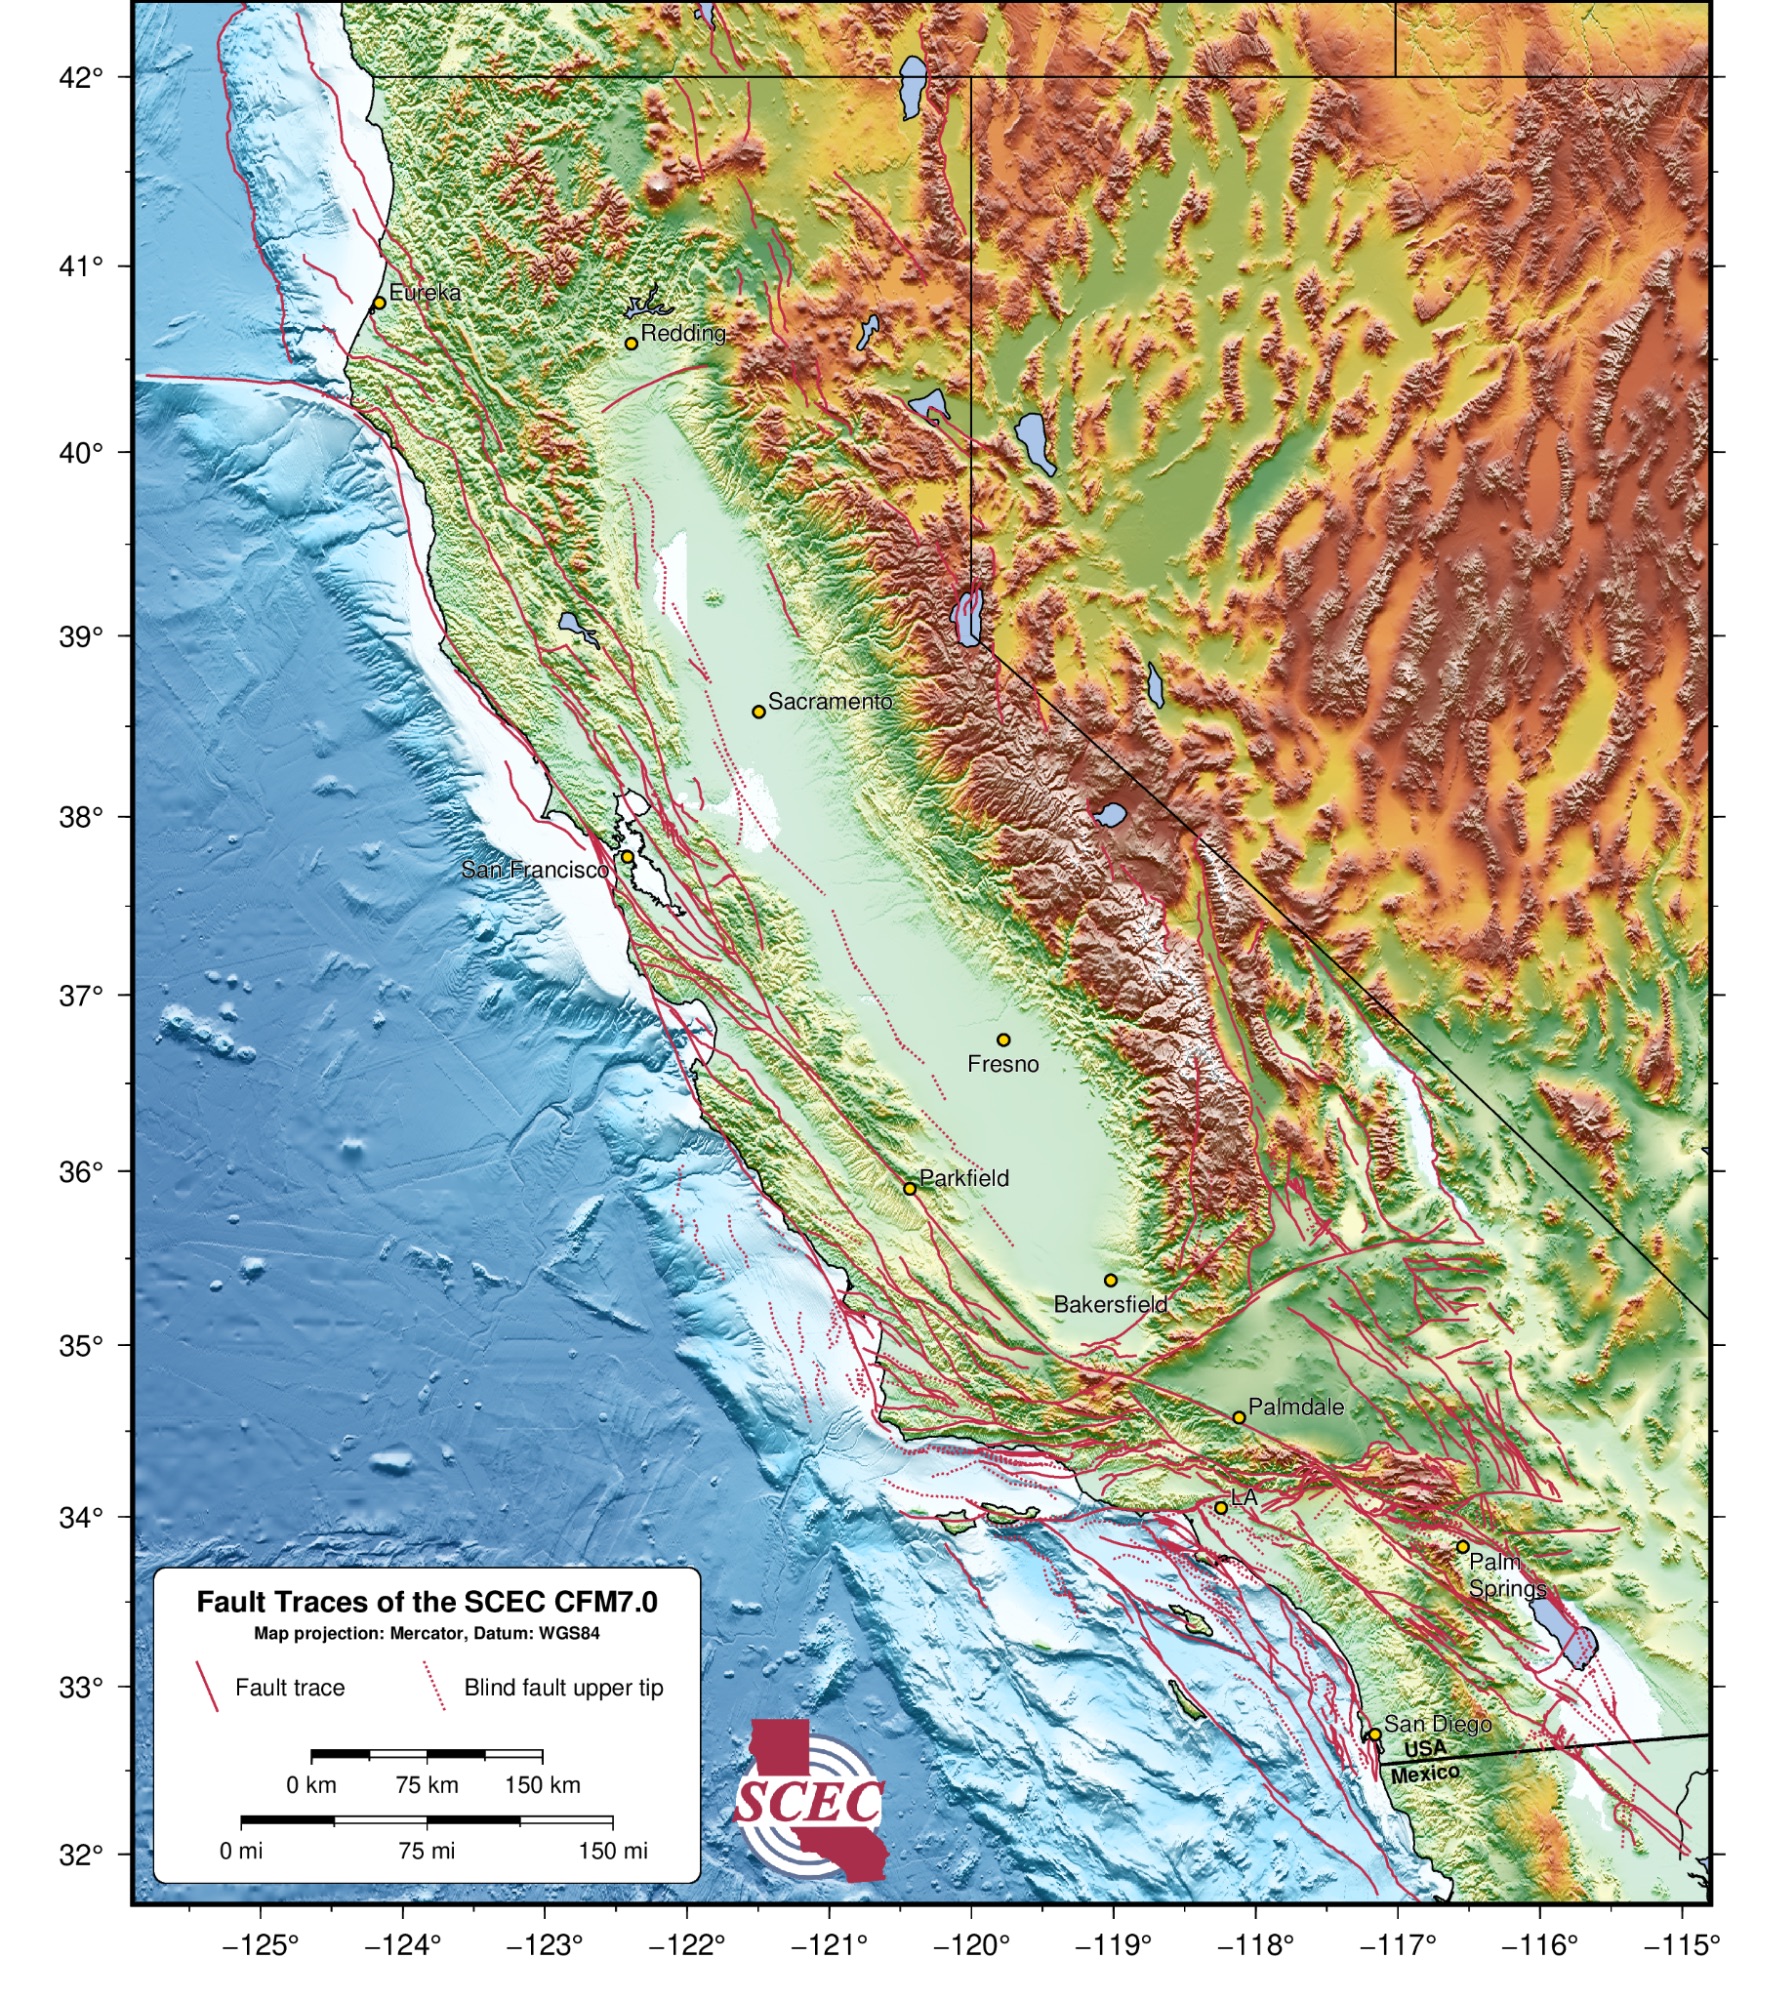
DEM & bathymetry, color
Other Software for Visualizing the CFM
CFM fault surfaces are distributed as open-source plain-text GOCAD t-surf (ASCII) files, which are straightforward and human-readable but can still be challenging to visualize—especially for new (and even experienced) users. Many users prefer to visualize GOCAD t-surf files using their own Python, R, or MATLAB codes. However, several software packages can also load and interact with GOCAD t-surfs in 3D. Aspen SKUA‑GOCAD is the primary platform used to build and maintain the CFM, but it requires a license. MOVE Suite by PE Limited also requires a license, though it may be available at no cost to qualifying academic institutions; it can directly import GOCAD t-surfs and provides tools for working with fault meshes. For a free option, MiraGeoscience offers 3D visualization and communication tools for integrated geoscience data and models. If you’re unfamiliar with the GOCAD file format, the GOCAD t-surf FAQ provides a quick overview and practical guidance.
Community Scripts for Parsing & Visualizing the CFM
Scott Marshall provides a downloadable ZIP file with scripts that help you view, parse, or convert SCEC CFM fault-surface files into formats that are easier to use in common software. The package includes:
ReadAndSaveCFM (Python) — Reads tsurf (*.ts) files and loads them into MATLAB; based on Brendan Meade’s MATLAB script ReadAndSaveCfm.m.
The Statewide California Earthquake Center (SCEC) prioritizes access to its software tools and data by both the scientific community and the public. Through open-source software and FAIR (Findable, Accessible, Interoperable, Reusable) data practices, we strive for SCEC software and data to remain discoverable, usable, and citable for future research.
To ensure proper credit for the development and use of SCEC Community Earth Models, we kindly request that you cite the specific model(s) you utilize in your research or for other applications. This helps track usage and acknowledge the contributions of the many model developers and researchers, who have invested significant effort and expertise to advance SCEC Community Earth Models.
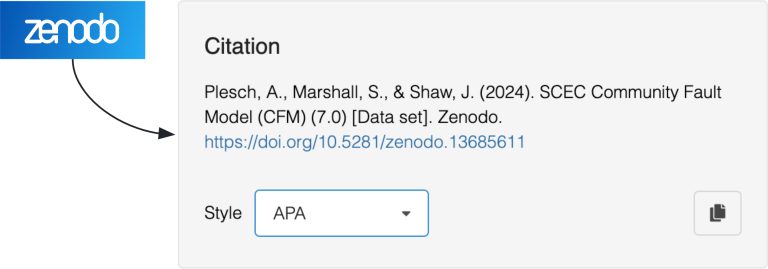
Most models have Digital Object Identifiers (DOIs) on Zenodo. Use the links below to find the appropriate citation:
The citation is typically located in a gray box labeled “Citation” on the right side of the Zenodo page. For example: